If while using Twitter you find yourself curious about the level of engagement your tweets are actually getting, you may want to take a closer look at your tweet analytics. The number of likes, retweets, or comments can only tell you so much about how your tweets are being received. But viewing your tweet analytics can give you a better idea of how well your tweets reach your audience.
To view your tweet analytics, you’ll need to visit your account’s Twitter Analytics dashboard, which will not only show your tweets’ like and retweet statistics but also more detailed tweet metrics like impressions and account metrics such as follows and mentions. In this guide, we’ll show you how to access your Twitter Analytics dashboard and individual tweet metrics. We’ll also answer a few of your Twitter Analytics questions.

screenshot
What can Twitter Analytics tell you? A quick tour of the dashboard
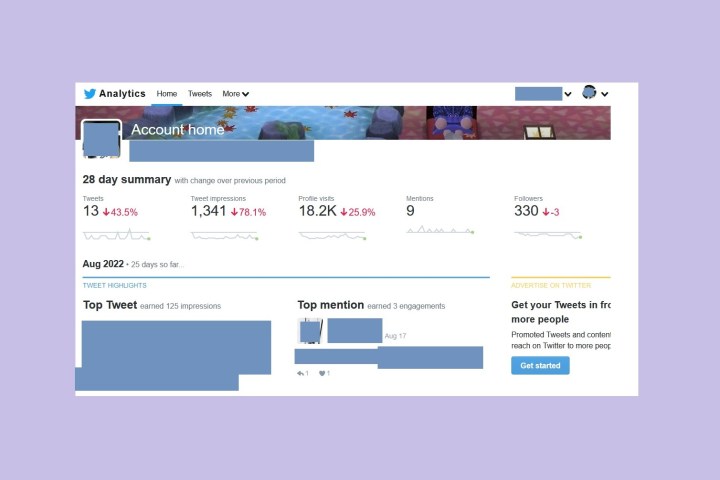
The Twitter Analytics dashboard is a webpage that’s updated every day and offers a wealth of information about your tweet activity and how other Twitter users respond to your tweets. When you first open the dashboard, you’ll be presented with the Home tab, which shows a 28-day summary of your tweet activity and account metrics. The Analytics dashboard will show you recent trends such as how often you tweet, how many impressions your tweets have received, how many profile visits you’ve had, the number of mentions you’ve received, and your current number of followers (including whether or not these numbers have gone up or down recently).
As you scroll down the Home tab of your dashboard, you’ll see monthly statistical summaries of your tweet activity. In these monthly summaries, the dashboard will actually highlight your best-performing tweets and mentions and show you who your top followers are. You’ll also see more general statistics about your tweet and account activity.
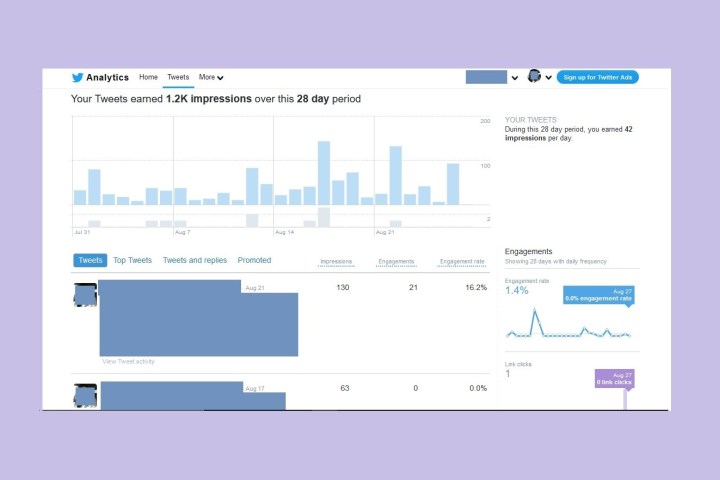
If you click on the Tweets tab, you’ll see a graph showing you the number of impressions your tweets earned over the course of a 28-day period. Impressions are the number of times your tweets were seen by other users. If you scroll down the Tweets tab, you’ll see your individual tweets listed with the following metrics displayed for each tweet: impressions, engagements (number of times other users interact with your tweets via actions like clicks and likes), and engagement rate (which is the number of engagements divided by the number of impressions). You can also click on each tweet listed to see a more detailed Tweet Activity screen, which shows you a further breakdown of your engagements.
On the right side of the screen, you’ll see the Engagements column, which shows you graphs of different metrics like engagement rate, link clicks, and replies.

screenshot
Can anyone use Twitter Analytics?
Yes, for the most part, you don’t have to have a special type of Twitter account to have access to the Twitter Analytics dashboard. Meaning, you don’t have to have a blue-check account, and it doesn’t seem to require a Twitter Blue subscription, either. Generally speaking, as long it meets the few basic requirements listed below, any free, regular Twitter account should be able to access the Twitter Analytics dashboard.
According to Twitter’s help guide on the matter, these are the requirements for being able to use the Twitter Analytics dashboard:
- The age of the account must be a minimum of 14 days.
- It can’t breach Twitter’s ads policy.
- It can’t be a deleted, suspended, or restricted account.
- The account must mainly tweet in one of the languages listed in the Twitter help guide linked above. Examples of such languages include English, Spanish, and Japanese.
How to access Twitter Analytics via the desktop website
You can access the full Twitter Analytics dashboard via Twitter’s desktop website. Just follow the steps outlined below.
Step 1: Go to Twitter.com and log in to your account if you haven’t already.

screenshot
Step 2: Once you’re logged in, select More.

screenshot
Step 3: From the menu that appears, choose Analytics. Another browser tab should open and display your Twitter Analytics dashboard.
How to access Twitter Analytics via the mobile app
Unfortunately, the full Twitter Analytics dashboard isn’t available in the mobile app. But while you can’t view the Twitter Analytics dashboard on the mobile app, you can still view the analytics for each of your individual tweets. Here’s how to do that:
Step 1: Open the mobile app and navigate to your desired tweet. It has to be a tweet you wrote (so either a regular tweet or a quote tweet you wrote).

screenshot
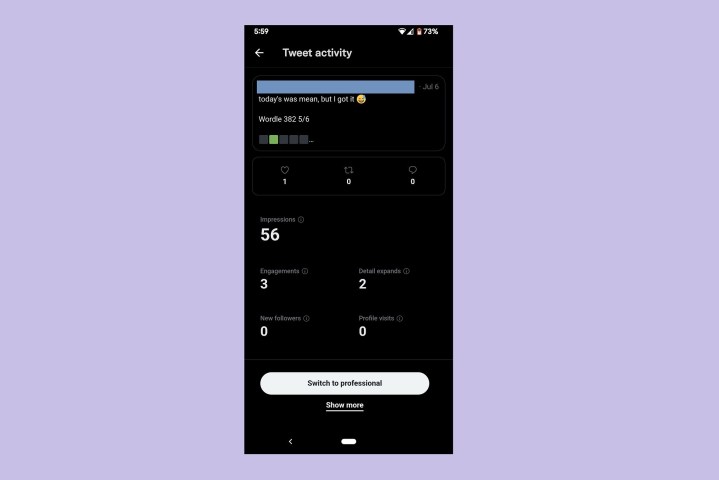
Step 2: At the bottom of that tweet, where all of the other icons for retweets and likes reside, select the icon that looks like a bar graph (three vertical lines of varying heights). This will open a Tweet activity screen for that tweet.

screenshot
Step 3: On the Tweet Activity screen, you’ll see limited tweet engagement statistics such as number of impressions, number of engagements, and the number of new followers recieved from that tweet.
Editors’ Recommendations
